

Particle Counting and Contamination Analysis in Fluid Power Systems
Typically most oil analysis companies have relied on spectrometric and debris analysis for the detec...
Of primary importance today in hydraulic systems and other filtered systems is oil cleanliness. Ingression of dirt and process contaminants leads to increases in the particle concentration of the lubricant, shortening machinery life and causing premature failure of components. It has been shown that 70-85% of hydraulic component failures is due to particulate contamination with up to 90% of these failures due to abrasive wear. To monitor oil cleanliness, laboratories conduct particle counting to determine the cleaniness code of the lubricant.
Particle count measurements are taken on typically 10 mL of oil with the results averaged to 1 mL. Prior to counting, the particles in the oil sample must be homogenized which can be accomplished in a combination of ways including shaking, sonication, de-gassing, etc. Most important is that sample preparation be carried out consistently. Once homogenized, samples are diluted 1:1 with a solvent that masks the presence of water and soft particles, typically a mixture of toluene and isopropanol. The presence of water in the sample can cause light-scattering that falsley increases the particle counts. Soft particles, such as insolubles, varnish and some oil additives, will also be erroneously counted if the diluent is not used. Once prepared the sample is loaded into a syringe and the contents of the oil are driven through the laser sensor at a controlled flow rate. The sensor “counts” the number of particles at the different size ranges for the duration of the test.
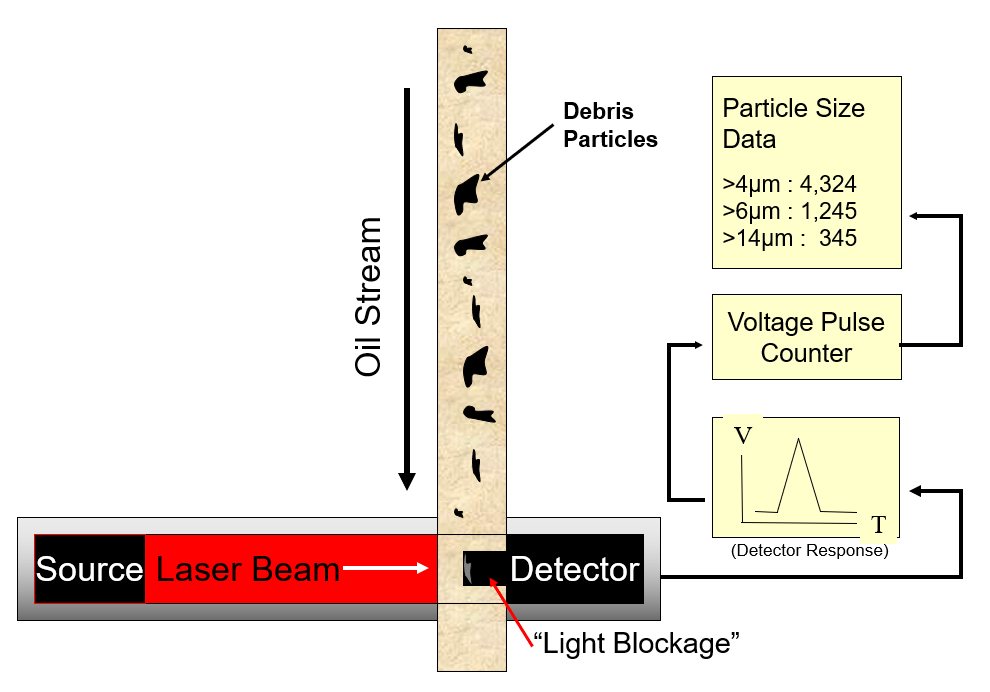
Figure - The illustation demonstrates how particles in the oil block the laser light. The blockage is detected as a voltage response which is "counted" by a voltage pulse counter.
Particle count instruments measure the number of particles at various size ranges. Current cleanliness measurement standards include 4µm, 6µm, 14µm, 21µm, 38µm and 71µm size ranges. Oil cleanliness can be measured against several standards including ISO 4406, SAE 4059, NAS 1638 (now defunct) among others. The ISO 4406 standard is the most commonly used and produces a three-tier cleanliness code (i.e. 21/19/13, see the example below).
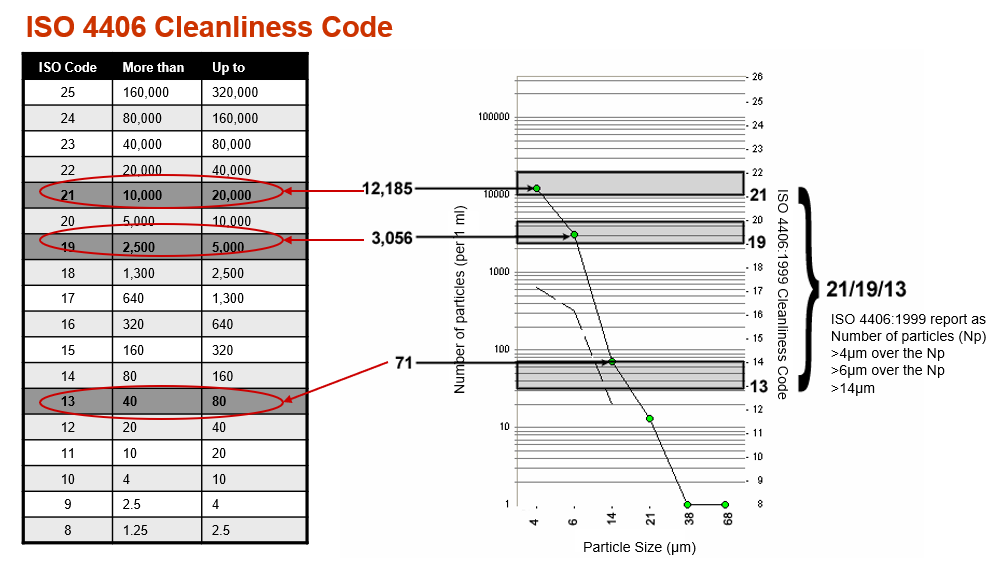
Figure - The most common cleanliness standard in use for lubricants is the ISO 4406:1999 Cleanliness Code standard. The diagram above demonstrates how the particle count/size data is converted into an ISO Cleanliness Code (21/19/13 in this case).
The following case study demonstrate the ability of oil analysis to reveal hidden failure modes. In this case study a large hydraulic reservoir in a pulp and paper mill suffered a filter by-pass indicator failure. The historic particle count (farthest chart to the left) shows that the typical ISO 4406:199 operating cleanliness code for this unit is 19/16/13. When the oil analysis testing indicated that the cleanliness code had jumped from 19/16/13 to 22/20/17 (middle chart) an operator was sent out to check the filter indicators on the unit. The electronic filter indicator was not lit, indicating that the filter was still performing its function and not operating in by-pass. Another oil sample was taken from the hydraulic unit in two months time (chart on right). This time the cleanliness code had jumped even higher, up to 24/23/22. Again the operator reported that the filter by-pass indicator was not lit.
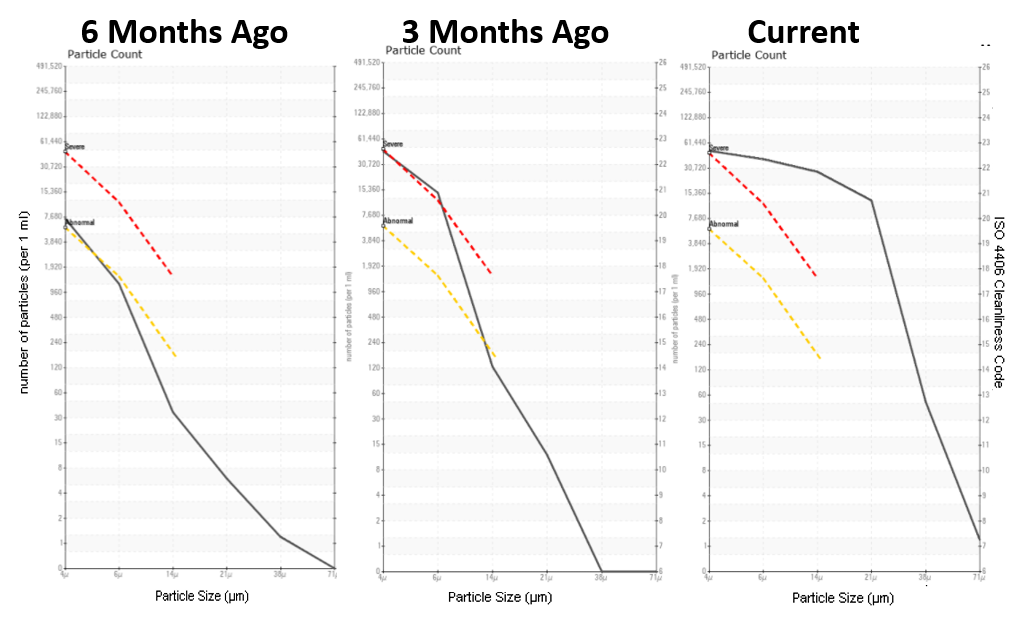
Figure - Over the period of six months the filter plugged, went into by-pass and the oil cleanliness code increased from 19/16/13 to 24/23/22.
Further investigation by the reliability team revealed that the indicator light had failed, and that the filter had, in fact, been operating in by-pass for many months. The filters were changed, the filter indicator was repaired and several months later (and several additional filter changes) the cleanliness codes were approaching their original level. The PMs for this unit were revised to include an electronic check of the filter indicators, as well as scheduled filter changes and a yearly clean-out and inspection of the reservoir.
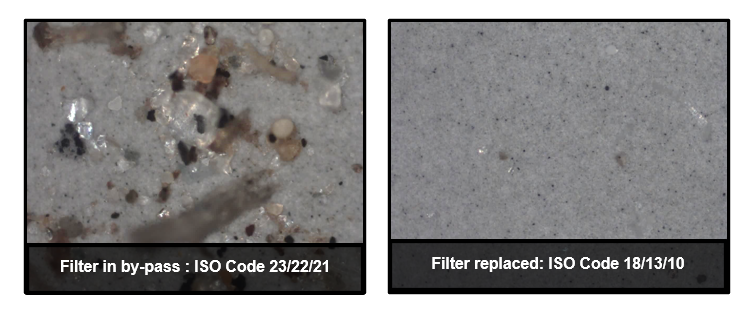
Figure - After the hidden failure was discovered (failed filter pressure indicator) and corrected, and after several subsequent filter changes, the oil cleanliness was reduced from 23/22/21 to 18/13/10.
Marine vessels use condition monitoring to extend overhaul periods on ship machinery. Routine analysis on the Controllable Pitch Propeller (CPP) hydraulic system showed a sudden increase in particle count results. The ISO 4406:1999 cleanliness code increased from 22/17/11 (far left chart) to 23/22/19 (middle chart) within a six month period at sea. The CPP hydraulic system was scheduled for inspection at the next docking to determine the cause. It`s worth noting that the visual screen photograph of the oil showed decreased clarity (top middle photograph).
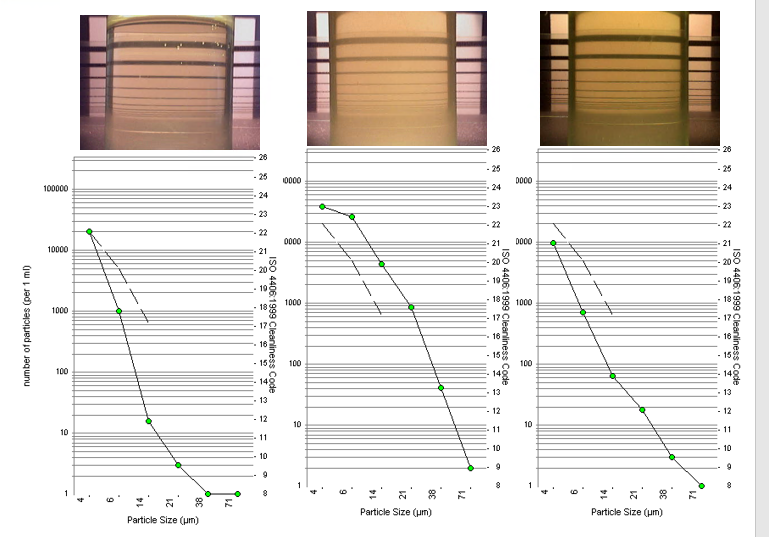
Figure - Routine oil analysis detected a dramatic increase in particulate in the critical CPP hydraulic system. The ISO cleanliness Code increased from 22/17/11 (left chart) to 23/22/19 (middle chart) and the oil clarity reduced visibily.
As a result of the most recent particle count results, the oil was drained from the Controllable Pitch Propeller (CPP) hydraulic system during the recent emergency docking. The sump tank was opened up, cleaned, inspected and found to be very dirty, and the system filters were changed. New oil was added to the system through 3 micron filters with the use of a portable filter cart. Offline filtration was carried out for eight days using 10µ and 3µ (micron) filters. A re-sample was sent to WearCheck for rush analysis. The results showed that the CPP hydraulic system cleanliness code decreased from 23/22/19 to 21/17/14 due to the reliability maintenance crews efforts and the vessel was approved for return to service. As a result of the critical nature of the CPP sytem, the oil was put on an increased sample schedule frequency.
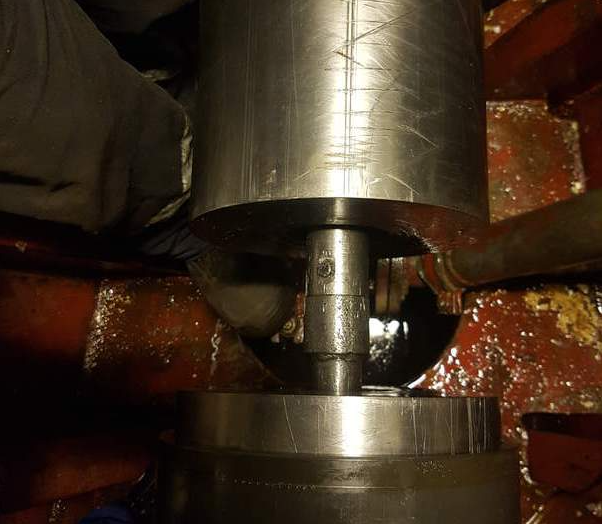
Figure - During an emergency inspection, the CPP hydraulic system reservoir was found to be very dirty. A sump cleaning followed by filter changes and off-line filtration for eight days returned the oil to the target cleanliness code level.

Typically most oil analysis companies have relied on spectrometric and debris analysis for the detec...

In the last technical bulletin we looked at four of the seven techniques used in Wearcheck"s oi...

It is widely accepted that oil contamination is the one of the major causes of component failure. Wh...

In our current economic age, companies are forced to pursue every avenue for cost saving to ensure t...

In today’s highly competitive global economy, the concept of machine reliability has led many an o...

There is no question that an effective oil analysis program lowers maintenance costs on rotating equ...